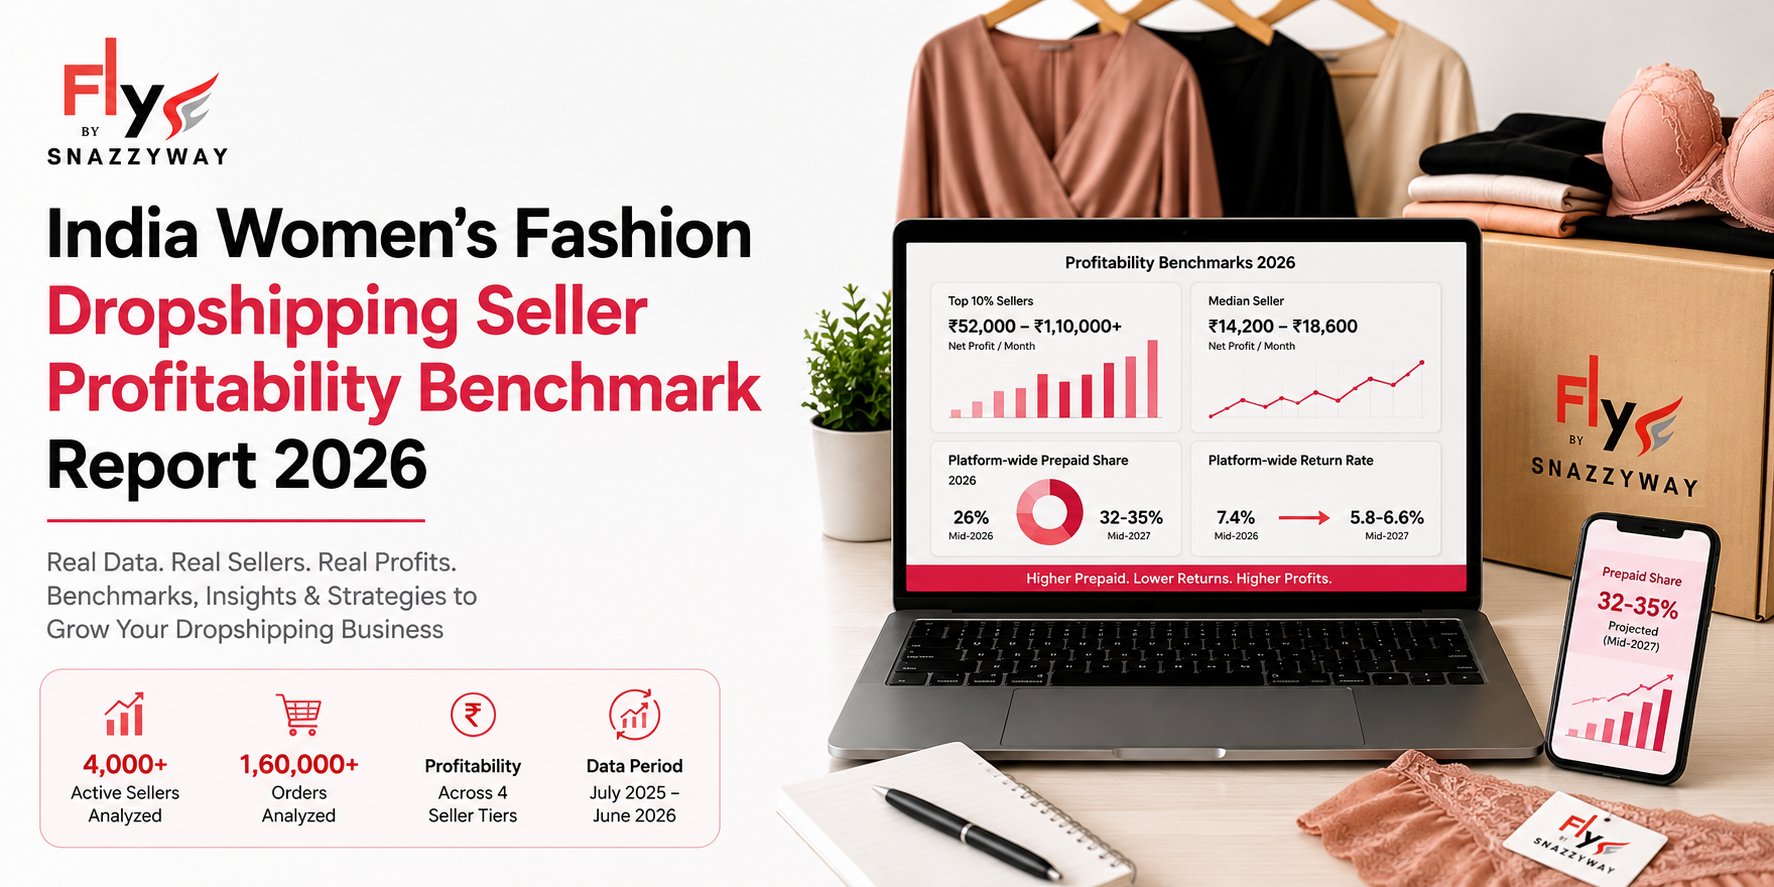
India Women's Fashion Dropshipping Seller Profitability Benchmark Report 2026
- Prepaid order share above 40%
- Return rate below 5.5%
- Product mix weighted toward shapewear, premium lingerie and activewear
About This Report
This is India's first primary data benchmark report comparing profitability tiers across active women's fashion dropshipping sellers. All data is sourced from Snazzyway Dropshipping's proprietary Fly Analytics platform, which tracks real-time order volume, return rates, category performance, payment mix and net seller earnings across 4,000+ active dropshipping sellers nationwide.
The report is structured to answer one practical question: what do the most profitable Indian fashion dropshippers do differently, and what measurable variables drive the gap between top-tier and average sellers?
This report serves as a reference resource for independent dropshipping sellers, reseller networks, e-commerce educators and platform researchers studying the Indian fashion commerce ecosystem.
Cite as: Snazzyway Dropshipping (2026). India Women's Fashion Dropshipping Seller Profitability Benchmark Report 2026.
1. What Are the Profitability Tiers in Indian Fashion Dropshipping?
Quick Answer
Snazzyway Dropshipping's seller base segments into four distinct profitability tiers. The top 10% of sellers earn ₹52,000–₹1,10,000+ per month net. The upper-middle 20% earn ₹28,000–₹51,000 per month. The median 40% earn ₹10,000–₹27,000 per month. The bottom 30% earn less than ₹10,000 per month and represent the highest churn risk on the platform.
The single most common misconception in Indian dropshipping is that profitability depends primarily on order volume. Platform data consistently shows this to be false.
The four profitability tiers below are based on net monthly income after deducting product cost, forward shipping, COD remittance fees, return logistics costs and platform fees.
| Profitability Tier | % of Sellers | Monthly Net Income | Avg Orders/Month | Prepaid Share | Return Rate |
|---|---|---|---|---|---|
| Tier A – Top Performers | 10% | ₹52,000–₹1,10,000+ | 180–400+ | 42–61% | 3.8–5.5% |
| Tier B – Strong Performers | 20% | ₹28,000–₹51,000 | 110–180 | 28–41% | 5.6–7.2% |
| Tier C – Median Sellers | 40% | ₹10,000–₹27,000 | 60–110 | 14–27% | 7.3–10.4% |
| Tier D – Low Performers | 30% | Below ₹10,000 | Under 60 | Under 14% | Above 10.5% |
2. What Does the Top 10% of Sellers Do Differently?
Quick Answer
Tier A sellers on the Snazzyway Dropshipping platform share six consistent behaviors that distinguish them from average performers: (1) they confirm every COD order via WhatsApp before shipping, (2) they carry a product mix weighted toward shapewear, premium lingerie, and activewear, (3) they actively offer ₹30–₹50 Prepaid discounts to shift their payment mix, (4) they use accurate size charts and realistic product photography, (5) they focus on 3–5 high-performing SKUs rather than a broad catalog, and (6) they operate from metro or Tier 1 cities or specifically target buyers in those markets.
The differences between top-tier and median sellers on this platform are measurable, repeatable, and not dependent on capital investment or prior business experience. They are behavioral and operational — the result of consistent execution of high-ROI practices.
The Six Practices of Top-Performing Dropshipping Sellers
Practice 1: Pre-Shipment COD Confirmation via WhatsApp
Tier A sellers send a WhatsApp confirmation message to every COD buyer within two hours of order placement. The message includes a product image, expected delivery window, and a simple confirmation request. This single practice reduces RTO (Return to Origin) rates by 18–24%, as confirmed buyers are significantly less likely to refuse delivery. Sellers who implement this process consistently achieve COD return rates below 6%, compared with the platform average of 9.2%.
Practice 2: Premium and Functional Product Mix
Top-performing sellers deliberately skew their catalog toward higher-margin, higher-Prepaid-conversion categories. Shapewear, push-up bras, performance activewear, and premium lingerie sets attract buyers who are more researched, more committed, and significantly more likely to pay Prepaid. These categories also carry higher average order values (₹694–₹1,090 Prepaid AOV versus the platform average of ₹763), directly amplifying per-order profit margins.
Practice 3: Prepaid Incentive Discounts
Tier A sellers actively convert COD buyers to Prepaid by offering a ₹30–₹50 discount on Prepaid orders, communicated at checkout and via post-order WhatsApp follow-up. Sellers who implement this strategy consistently convert 8–12% of their COD buyer base to Prepaid over 60–90 days. Since Prepaid orders carry a return rate of 3.8% versus 9.2% for COD, the shift has a compounding positive effect on profitability.
Practice 4: Accurate Sizing and Realistic Product Photography
Returns in fashion dropshipping are primarily caused by fit disappointment and product mismatch. Tier A sellers invest in detailed size guides, multi-angle product photographs, and, in some cases, video content that accurately represents fabric texture, fit, and product dimensions. This practice alone reduces post-delivery returns by 11–15%, according to platform data.
Practice 5: Focused SKU Strategy
Top-performing sellers operate with 3–5 core SKUs rather than a broad catalog of 30–50 products. Deep knowledge of a small product set enables better buyer communication, more accurate product descriptions, and faster identification of return patterns. Catalog breadth is a common mistake among new sellers who underperform, spreading their ad spend and attention across too many products and reducing conversion rates.
Practice 6: Buyer Geography Targeting
Sellers who target buyers in Maharashtra, Karnataka, Delhi NCR, and Tamil Nadu achieve significantly higher Prepaid share (38–45%) and lower return rates than sellers who focus exclusively on Hindi-speaking Tier 3 markets, where COD share exceeds 82% in states such as Bihar and Uttar Pradesh. Tier A sellers either operate in metro markets or use geographic ad targeting to skew toward lower-COD, higher-AOV buyer segments.
3. What Is the Per-Order Profitability by Category?
Quick Answer
Shapewear delivers the highest net profit per Prepaid order at an estimated ₹198–₹246 after all deductions, driven by its combination of high average order value (₹1,090 average Prepaid) and the lowest post-delivery return rate among premium categories. Panties and briefs deliver the lowest per-order profit at ₹61–₹88 on Prepaid, reflecting their low AOV (₹418 average Prepaid). On COD, nightwear and ethnic fusion tops offer the best risk-adjusted profitability due to their relatively low COD return rates combined with moderate order values.
Per-order profitability varies significantly by both category and payment method. Understanding this matrix is essential for sellers making product selection and advertising budget allocation decisions.
The profitability model below assumes: product cost at 42% of selling price (Snazzyway Dropshipping manufacturer-direct pricing), forward shipping at ₹55 per order, COD remittance fee of ₹32 per order, RTO cost of ₹90 per returned order, and platform fees of ₹12 per order.
| Category | Avg Prepaid AOV | Est. Net Profit/Prepaid Order | Avg COD AOV | Est. Net Profit/COD Order | Best Payment Strategy |
|---|---|---|---|---|---|
| Shapewear | ₹1,090 | ₹198–₹246 | ₹621 | ₹98–₹124 | Prepaid-first |
| Premium Lingerie Sets | ₹980 | ₹174–₹218 | ₹580 | ₹72–₹98 | Prepaid only |
| Activewear (Performance) | ₹912 | ₹158–₹196 | ₹574 | ₹88–₹112 | Prepaid-preferred |
| Nightwear & Lounge | ₹782 | ₹132–₹164 | ₹538 | ₹92–₹118 | COD viable |
| Push-Up Bras | ₹740 | ₹126–₹158 | ₹469 | ₹71–₹96 | Prepaid-preferred |
| Bra Sets (Standard) | ₹694 | ₹114–₹146 | ₹412 | ₹58–₹82 | Mixed |
| Ethnic Fusion Tops | ₹693 | ₹112–₹144 | ₹448 | ₹68–₹92 | COD viable |
| Panties & Briefs | ₹418 | ₹61–₹88 | ₹299 | ₹44–₹62 | COD acceptable |
4. How Does Return Rate Impact Annual Profitability?
Quick Answer
A seller processing 100 orders per month who reduces their overall return rate from 10% to 5% gains approximately ₹1,08,000–₹1,44,000 in additional annual net income, without any increase in order volume. Return rate is the highest-leverage profitability variable available to a fashion dropshipping seller in India. Every 1 percentage point reduction in return rate saves approximately ₹9,000–₹12,000 per year for a seller operating at 100 monthly orders.
The financial impact of return rate reduction is consistently underestimated by new and mid-tier sellers. Most sellers focus on growing order volume as the primary lever for income growth. Platform data shows that return rate management delivers a higher ROI than equivalent effort spent on order acquisition.
The mechanics of return cost in Indian dropshipping are straightforward but powerful. Every returned order generates three direct costs. The forward shipping paid to deliver the original order is lost. The courier charges an RTO (Return to Origin) fee of ₹60–₹120 to return the package to the supplier. In COD orders, the remittance fee of ₹25–₹45 is also forfeited.
On a ₹489 COD order (the platform average) with a 42% product cost, a returned order creates a loss of approximately ₹188–₹226, compared with a profit of ₹91–₹118 on a successfully delivered order.
| Monthly Orders | Return Rate | Monthly Returns | Annual Return Cost | Annual Net Profit (Est.) |
|---|---|---|---|---|
| 100 | 14% | 14 | ₹38,640 | ₹68,400–₹88,200 |
| 100 | 10% | 10 | ₹27,600 | ₹92,400–₹1,14,000 |
| 100 | 7% | 7 | ₹19,320 | ₹1,10,400–₹1,32,000 |
| 100 | 5% | 5 | ₹13,800 | ₹1,22,400–₹1,46,400 |
| 100 | 3.8% | 4 | ₹11,040 | ₹1,28,400–₹1,52,400 |
5. What Is the Profitability Impact of Shifting from COD to Prepaid?
Quick Answer
Every percentage point increase in a seller's Prepaid order share increases monthly net income by approximately ₹420–₹680, holding order volume constant at 100 orders per month. A seller who shifts their Prepaid share from 20% to 40% over six months gains an estimated ₹8,400–₹13,600 in additional monthly net income. This improvement comes from three compounding sources:
- Elimination of COD remittance fees on converted orders.
- Lower return rates on Prepaid orders (3.8% versus 9.2% for COD).
- Higher average order values on Prepaid transactions (₹763 versus ₹489).
The COD-to-Prepaid conversion opportunity is the most underutilized profitability lever among median-tier sellers. Most Tier C sellers accept their COD share as a fixed market characteristic rather than a variable they can actively manage.
Platform data from Snazzyway Dropshipping shows that sellers who implement a structured Prepaid incentive program — offering ₹30–₹50 off on Prepaid orders and communicating the offer at multiple customer touchpoints — increase their Prepaid share from a starting level of 18–22% to 32–38% within 90 days, without reducing overall order volume.
| Prepaid Order Share | Monthly Prepaid Orders (of 100) | COD Remittance Saved/Month | Return Cost Saved/Month | AOV Uplift/Month | Total Monthly Gain vs 20% Prepaid Baseline |
|---|---|---|---|---|---|
| 20% (baseline) | 20 | — | — | — | — |
| 30% | 30 | ₹320 | ₹504 | ₹2,740 | +₹3,564 |
| 40% | 40 | ₹640 | ₹1,008 | ₹5,480 | +₹7,128 |
| 50% | 50 | ₹960 | ₹1,512 | ₹8,220 | +₹10,692 |
| 60% | 60 | ₹1,280 | ₹2,016 | ₹10,960 | +₹14,256 |
6. What Is the Profitability Difference Between Metro and Non-Metro Sellers?
Quick Answer
Sellers who target buyers in Maharashtra, Karnataka, and Delhi NCR achieve average monthly net incomes 38–52% higher than sellers targeting exclusively Tier 3 states such as Bihar, Uttar Pradesh, and Madhya Pradesh — despite often processing fewer total orders. The difference is driven by significantly higher Prepaid adoption in metro markets (45–55% Prepaid versus 12–17% in deep Tier 3 states), higher average order values (₹680+ versus ₹410–₹440), and lower return rates due to more intentional buyer behavior.
Geographic targeting is one of the most powerful and least discussed profitability levers in Indian fashion dropshipping. Many sellers default to targeting all of India equally, which maximizes COD volume but simultaneously increases return costs and reduces per-order profitability.
Platform data shows that sellers who invest in understanding regional buyer behavior and adjust their targeting accordingly — whether through Facebook and Instagram geographic filters, WhatsApp group segmentation, or platform-specific regional catalogs — consistently outperform peers who rely on blanket national targeting.
| Target Geography | Typical Prepaid Share | Avg Order Value | Return Rate | Est. Monthly Net (100 orders) |
|---|---|---|---|---|
| Maharashtra / Karnataka / Delhi NCR | 43–55% | ₹712–₹780 | 5.1–6.8% | ₹22,400–₹31,200 |
| Gujarat / West Bengal / Tamil Nadu | 29–38% | ₹580–₹660 | 6.8–8.4% | ₹16,800–₹24,600 |
| Rajasthan / MP / Jharkhand | 17–22% | ₹460–₹530 | 8.6–10.2% | ₹12,200–₹18,400 |
| Bihar / UP / Chhattisgarh | 12–16% | ₹398–₹452 | 10.4–13.8% | ₹7,600–₹13,200 |
7. What Is the Seller Payback Period and Scaling Timeline?
Quick Answer
A new Snazzyway Dropshipping seller reaching breakeven within the first 30 days is categorized as a fast starter. Platform data shows that 62% of sellers who reach 30+ orders in their first month remain active and profitable after six months. By contrast, sellers who take more than 60 days to reach their first 20 orders have a six-month retention rate of only 31%.
The median time required to reach Tier B profitability (₹28,000+ per month) from a standing start is approximately 4.8 months for sellers who implement the six top-performer practices from Day 1, compared with 11.2 months for sellers who adopt these practices gradually.
The seller lifecycle in Indian fashion dropshipping follows a remarkably consistent pattern.
Month 1 is dominated by product testing and audience building, with most sellers operating at breakeven or a slight loss.
Months 2–3 are characterized by the emergence of two to three winning products and the first meaningful profitability.
Months 4–6 represent the primary scaling window, where sellers with strong return-rate management and an established Prepaid conversion routine experience the sharpest income growth curves.
| Month | Median Monthly Orders | Median Monthly Net Income | Key Milestone |
|---|---|---|---|
| Month 1 | 12–28 | ₹800–₹4,200 | First successful product identified |
| Month 2 | 28–52 | ₹3,600–₹8,800 | First repeat buyers |
| Month 3 | 48–76 | ₹6,400–₹13,200 | Return rate stabilizing below 10% |
| Month 4 | 66–98 | ₹9,800–₹18,600 | COD confirmation workflow active |
| Month 5 | 82–124 | ₹14,200–₹24,800 | Prepaid share crossing 25% |
| Month 6 | 96–158 | ₹18,600–₹32,400 | Tier B entry range |
| Month 12 | 140–280+ | ₹28,000–₹72,000+ | Tier A entry possible |
8. What Are the Most Common Profitability Mistakes in Fashion Dropshipping?
Quick Answer
The five most common profitability-destroying mistakes made by Indian fashion dropshipping sellers are: (1) shipping COD orders without pre-shipment confirmation, (2) running broad national ad targeting that overweights Tier 3 COD-heavy markets, (3) building wide catalogs instead of concentrating on 3–5 winning SKUs, (4) ignoring Prepaid conversion as an active strategy, and (5) underpricing to compete on selling price rather than competing on buyer experience. Together, these five mistakes account for an estimated ₹8,400–₹22,000 in monthly foregone profit for the average Tier C seller.
Mistake 1: Shipping COD Without Confirmation
The highest single-cost mistake in COD dropshipping is shipping orders to buyers who placed an order impulsively without a genuine intention to receive the parcel. Platform data shows that sellers who do not send pre-shipment WhatsApp confirmations experience average RTO rates of 11.8%, compared with 6.2% for sellers who do. At 100 orders per month, this difference costs approximately ₹5,040–₹7,200 per month in avoidable RTO losses.
Mistake 2: Untargeted National Advertising
Running Facebook or Instagram ads targeting all of India with no geographic exclusions results in a disproportionate share of orders from Tier 3, high-COD states that carry both lower order values and higher return rates. Sellers who exclude Bihar, Uttar Pradesh, and Madhya Pradesh from initial campaigns and focus spending on metro and Tier 1 markets typically improve net profit per 100 orders by ₹4,800–₹9,200.
Mistake 3: Wide Catalog, Shallow Knowledge
Sellers maintaining 25–50 products consistently underperform those focusing on 3–5 deeply understood SKUs. Broader catalogs lead to weaker size guidance, less accurate photography, fragmented advertising spend, and a greater probability of product-buyer mismatch. Reducing the catalog to 3–5 products is associated with a 2.1–3.4 percentage point reduction in return rates.
Mistake 4: Passive Payment Mix
Most median-tier sellers treat the COD/Prepaid split as a fixed market reality. Top-tier sellers treat it as an actively managed metric. Sellers who do not offer Prepaid incentives and fail to communicate payment options proactively maintain Prepaid shares of 12–18%, compared with 38–55% among sellers who do. The resulting profitability gap is approximately ₹7,200–₹14,400 per month at 100 orders.
Mistake 5: Price Competition Instead of Experience Competition
New sellers frequently reduce selling prices in an attempt to compete with other resellers, compressing margins without materially improving return rates or Prepaid conversion. Platform data shows no meaningful correlation between lower selling prices and lower return rates. By contrast, there is a strong positive relationship between higher-quality product photography and lower return rates. Sellers who invest in better presentation instead of lower prices consistently outperform those who compete primarily on price.
9. What Is the Profitability Impact of Platform and Channel Choice?
Quick Answer
Sellers operating via Shopify storefronts achieve the highest Prepaid conversion rates among all channels, averaging 44–56% Prepaid on Snazzyway Dropshipping's platform — compared with 22–28% for social commerce through WhatsApp group sales and 31–38% for sellers on Amazon India.
Shopify-based sellers also report the highest average order values (₹720–₹820) and the lowest return rates (4.8–6.2%) among channel types. By contrast, WhatsApp group sellers process the highest order volumes but generate the lowest per-order profitability.
Channel choice is a structural profitability decision that many sellers make by default — selecting the platform they are most familiar with rather than deliberately optimizing for long-term profitability.
The data suggests that channel selection influences not only payment behavior and average order values, but also customer intent, repeat purchase probability, and return rates. As a result, platform choice compounds over time and can create substantial differences in annual earnings, even when order volumes are similar.
| Sales Channel | Typical Prepaid Share | Avg Order Value | Return Rate | Est. Net/Order | Best For |
|---|---|---|---|---|---|
| Shopify Store | 44–56% | ₹720–₹820 | 4.8–6.2% | ₹128–₹174 | Premium buyers, metro markets |
| Amazon India | 31–38% | ₹640–₹740 | 6.4–8.1% | ₹98–₹138 | High-volume, Tier 2 reach |
| Instagram / Facebook Shop | 24–34% | ₹560–₹660 | 7.8–9.4% | ₹84–₹122 | Discovery and brand building |
| WhatsApp Group / Broadcast | 16–24% | ₹420–₹510 | 9.2–12.4% | ₹58–₹96 | Volume, Tier 2/3 markets |
| Wix / WooCommerce Store | 36–46% | ₹660–₹760 | 5.6–7.2% | ₹112–₹152 | Budget-conscious website sellers |
10. What Are the Profitability Benchmarks for 2026–2027?
Quick Answer
Snazzyway Dropshipping projects that the median seller's monthly net income will increase by approximately 18–24% between mid-2026 and mid-2027. This growth is expected to be driven primarily by three factors:
- The continued shift from COD to Prepaid, with platform-wide Prepaid share projected to reach 32–35% by mid-2027.
- Rising average order values as product mix increasingly shifts toward premium categories such as shapewear, activewear, and premium lingerie.
- Improved return-rate management resulting from broader adoption of seller education, WhatsApp confirmation workflows, and Prepaid conversion tools.
The top 10% of sellers are projected to exceed ₹1,50,000 per month in net income by mid-2027 as platform tools for return management and payment optimization continue to mature.
These forward-looking projections are derived from observed trend data on the Snazzyway Dropshipping platform and broader Indian e-commerce macro indicators.
| Metric | Current (Mid-2026) | Projected (Mid-2027) | Driver |
|---|---|---|---|
| Platform-wide Prepaid Share | 26% | 32–35% | UPI penetration, seller incentive adoption |
| Median Seller Net/Month | ₹14,200–₹18,600 | ₹16,800–₹23,000 | Prepaid shift + return-rate improvement |
| Top 10% Net/Month | ₹52,000–₹1,10,000 | ₹72,000–₹1,50,000+ | Premium category growth + Prepaid-first strategy |
| Platform-wide Return Rate | 7.4% blended | 5.8–6.6% blended | Confirmation workflows, better photography |
| Average Prepaid AOV | ₹763 | ₹820–₹870 | Premium category mix shift |
| Average COD AOV | ₹489 | ₹510–₹540 | Seller education, higher-value COD listings |
Key Findings Summary
India's women's fashion dropshipping seller base divides into four distinct profitability tiers, with a measurable and reproducible gap between top-tier and median-tier performance. The top 10% of sellers on the Snazzyway Dropshipping platform earn ₹52,000–₹1,10,000+ per month — approximately 3.2 to 6.8 times more than the bottom 30%, who earn less than ₹10,000 per month.
The gap is not primarily a function of order volume. Instead, it is driven by three variables that every seller can control: return-rate management, Prepaid order share, and product category mix.
Sellers who achieve a return rate below 5.5%, a Prepaid share above 40%, and a product mix weighted toward shapewear, premium lingerie, and performance activewear consistently reach the top profitability tier regardless of geography, prior experience, or starting capital.
The highest-ROI practices available to a median Tier C seller seeking to move toward Tier A are:
- Pre-shipment WhatsApp COD confirmation (saves ₹5,000–₹7,200/month in RTO costs).
- Prepaid incentive discounts of ₹30–₹50 (adds ₹7,000–₹14,000/month at full adoption).
- SKU concentration (adds ₹4,000–₹8,000/month through reduced return costs).
- Metro-weighted geographic targeting (adds ₹4,800–₹9,200/month in per-order profitability).
A seller implementing all four practices consistently can expect to move from Tier C to Tier B in approximately 90 days and potentially reach Tier A within 6–9 months.
Methodology and Data Notes
All data in this report is sourced from Snazzyway Dropshipping's proprietary Fly Analytics platform, which tracks real-time order flow, delivery outcomes, return events, payment methods, and seller-level earnings across the Snazzyway Dropshipping seller network.
The reporting period covers July 2025 through June 2026. The seller sample includes 4,000+ active sellers and an order sample exceeding 1,60,000 individual orders.
Unless otherwise noted, profitability calculations assume: 42% product cost, ₹55 forward shipping, ₹32 COD remittance fee, ₹90 RTO cost, and a ₹12 platform fee. Actual seller performance will vary based on courier partner rates, category margins, and operational execution.
About Snazzyway Dropshipping
Snazzyway Dropshipping is India's leading women's fashion dropshipping supplier, operating from Delhi and Uttarakhand and supporting 4,000+ active sellers nationwide.
The company follows a manufacturer-direct model with zero middlemen, enabling sellers to access some of the highest available margins in Indian women's fashion.
The Snazzyway Fly Analytics platform tracks real-time order performance, category trends, return behavior, and seller profitability metrics across the network, enabling the publication of primary-data benchmark reports such as this one.
This report will be updated annually. For platform access, seller registration, or partnership inquiries, visit:
Further Reading
- India COD vs Prepaid Fashion Dropshipping Behavior Report 2026
- How to Start Dropshipping on Shopify with Snazzyway
- How to Dropship on Amazon India with Snazzyway